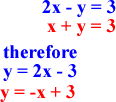
Solve the Following Linear Equation Graphically


Solve the Following Linear Inequalities
Hint: Answer is always graphically

 Answer is the region highlighted ({), since its where the two regions meet.
Hint: Answer is always graphically

 Answer is the region highlighted ({), since its where the two regions meet.
Notice: that the lines (y < -x +3 , and y > 2x - 3) are dotted. This is because in linear inequalities a point(s) can only be in 3 areas. These are: BELOW the line, ABOVE the line, OR ON the line. In this case "y < -x +3" is below, and "y > 2x -3" is above.
Notice: that the point where the two lines meet is an open circle. This is because the two regions can go infinitely close to that point but they will never intersect at that point.
Notice: that the point where the two lines meet is an open circle. This is because the two regions can go infinitely close to that point but they will never intersect at that point.
WHAT IF Y IS ALSO EQUAL TO THE LINE?
 This Concept can be applied to any other shape (Circles, parabola, radical, etc.). Lets see Parabolas.
in Parabolas the region is either INSIDE, OUTSIDE or ON the parabola.
Example:
y <>
ONE MORE THING TO REMEMBER
FINALLY...THE NEXT SCRIBE WILL BE me...jk....Its eedce. Have fun!
 This Concept can be applied to any other shape (Circles, parabola, radical, etc.). Lets see Parabolas.
in Parabolas the region is either INSIDE, OUTSIDE or ON the parabola.
Example:
y <>

ONE MORE THING TO REMEMBER
When solving any inequality equation, if you divide/multiply by a negative, don't forget to change the direction of the inequality sign (<,>).
Example. When Solving 2x - y < 3
-y < -2x + 3 Divide both sides by a NEGATIVE.
y > 2x - 3
using the point (2,2)
Using the correct equation.
y > 2x -3
2 > 4 - 3 TRUE
BUT IF WE USE THE WRONG EQUATION.
y < 2x -3
2 < 4 - 3 FALSE Since 2 is greater, not less than 1
Example. When Solving 2x - y < 3
-y < -2x + 3 Divide both sides by a NEGATIVE.
y > 2x - 3
using the point (2,2)
Using the correct equation.
y > 2x -3
2 > 4 - 3 TRUE
BUT IF WE USE THE WRONG EQUATION.
y < 2x -3
2 < 4 - 3 FALSE Since 2 is greater, not less than 1

Thanks for choosing me for scribe for the weekend :). How lucky am I? Haha. One question- What program did you use to make your graphs? They're really well drawn and clear.
ReplyDeleteThis comment has been removed by the author.
ReplyDeleteI used macromedia Fireworks FX2004.
ReplyDeleteAmazing pictures, very well drawn.One question, where did you get the program?
ReplyDelete