 Hey everyone,
It's me m@rk again, hoping to answer all your questions, concerns, complaints, compliments, confusions, uncertainties, anxieties or other inquiries.
First of all we started with a few questions from our last night's homework. The question was:
81^1/2+cuberoot of 8-32^3/5+32^-1/2 Its simple just simplify every term into whole numbers.
9+2-8+1/2 Do the math subtract and add the like terms
3+1/2 Change 3 into a fraction
6/2+1/2 Add the fractions with like denominators
7/2
Another on was:
2/3 (4x-1)-3/4 (5-2x)=1-3/2 (3x-1) Get the LCM of the denominators which is 12 and multiply it to each term
8(4x-1)-9(5-2x)= 12-18 (3x-1) Multiply
32x-8-45+18x=-18x+6 Transpose
32x+18x+18x=6+8+45 Add
68x=59 Divide
x=59/68
Now let's get into today's lesson:
First off Mr. K showed us the past formula: y=a (x-h)^2+k
Flashback
If the parameter a is negative the parabola has a maximum therefore it opens down.
If the parameter a is positive the parabola has a minimum therefore it opens up.
If the parameter h is positive the parabola moves right.
If the parameter h is negative the parabola moves left.
Reminder: Watch the sign of h.
If the parameter k is positive the parabola shifts up.
If the parameter k is negative the parabola shifts down.
Now lets add it to today's lesson.
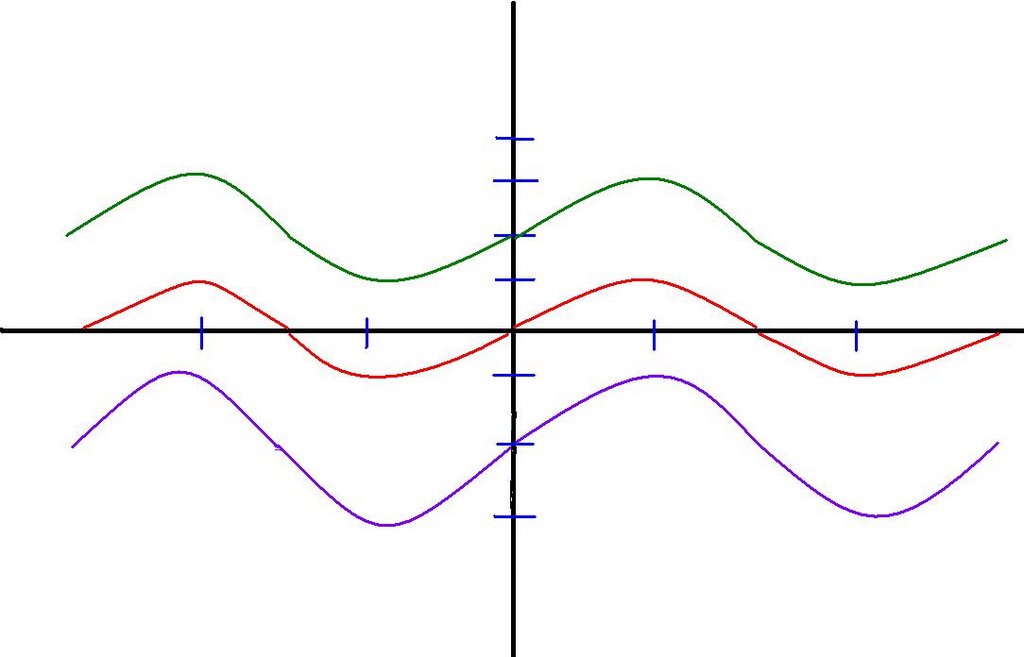 The red one represents the graph for y=sin(x)
The purple one represents the graph for y=sin (x) -2
The green one represents the graph for y=sin(x)+2
The bold numbers are like the parameter k from the previous formula. If it is positive the graph moves up k value. If it is negative the graph moves down k value. Can you see it?
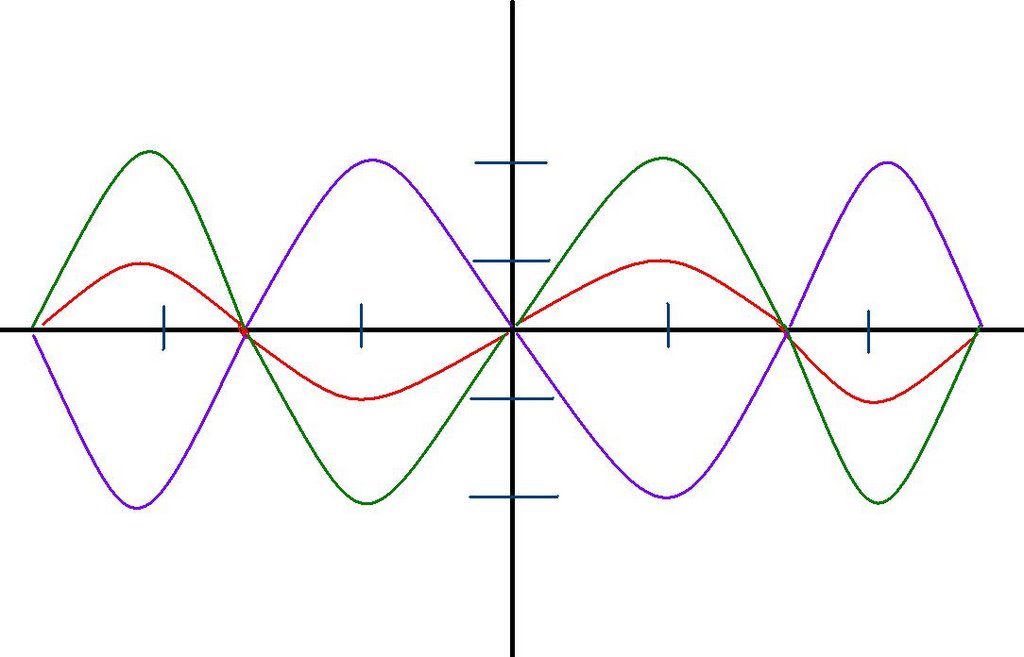 The red one represents the graph for y=sin(x)
The purple one represents the graph for y=-2sin (x)
The green one represents the graph for y=2sin(x)
The bold numbers are like the parameter a from the previous formula. If it is negative the graph opens down. If it is positive the graph opens up.It also determines its maximum and minimum.Do you get it?
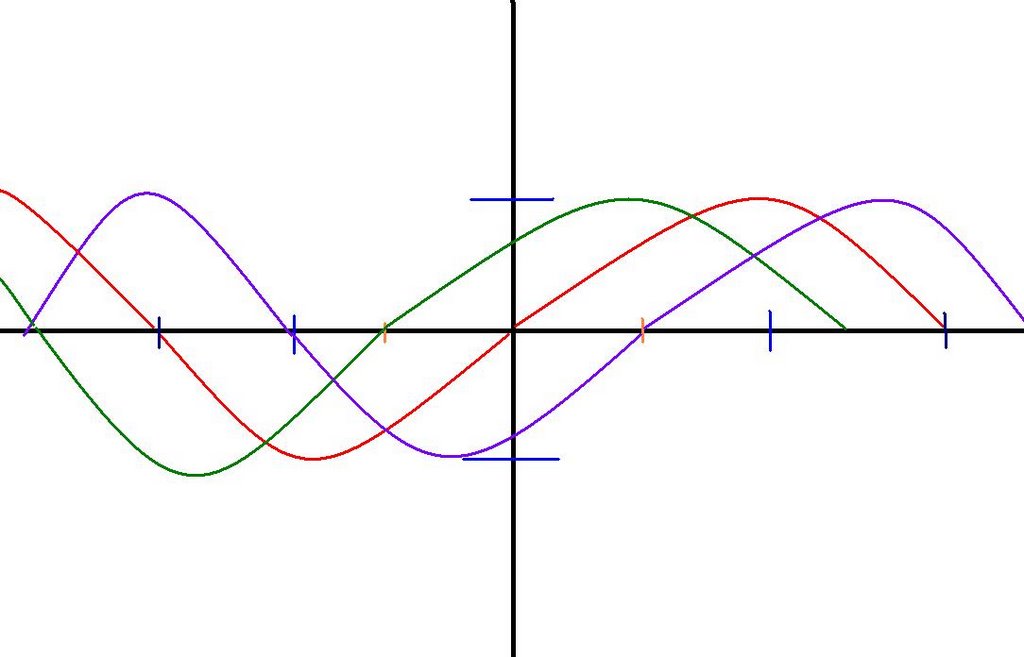 The red one represents the same graph for y=sin(x)
The green one represents the graph for y= sin(x+45)
The purple one represents the graph for y=sin (x-45)
The bold numbers are like the parameter h from the previous formula.If it is positive it moves right h units. If it is negative it moves left h units.WARNING:Watch out for the sign of h.
Now I'm gonna introduce you to the brand new formulas:
y=Asin B (x-C) +D and y=Acos B (x-C)+ D
If you are confuse they are just the same.It is similar to the previous formula we had about parabolas which is y=a(x-h)^2+k.
Now lets apply all things we learned and graph the equation for y=2sin(x-45)-1
 If you get a graph similar to mine looks like you've mastered how to flip and move a sine wave.
Thank you very much for spending your time on reading my scribe. I hope that you've learned something.(Eventhough that my pictures are not perfect).
We have no homework tonight!!!!!
It is my honour to tell you that the next scribe will be the ONe and only "benof school". HAVE FUN.


..
ReplyDelete\/
Hi Mark,
ReplyDeleteCongratulations on a great post! I particularly liked your introduction!!
And IMHO your questions were very effective; anyone reading the scribe takes a moment to stop and think before continuing.
Best,
Lani
if h is negative, the parabola moves right, if it's positive - then it moves left. -jmargraf@hotmail.com
ReplyDelete